Step by step guide on how to use the Online Chemical Analysis System (OCAS).
*Hover your mouse over a control unit (Button or Dropbox) will give user instant help.
1) Register an account at www.ChemoPower.com/OCAS/. You will be given CP$2000 upon registration. Analysis of the co-eluted peaks done within the software is free but generating a copy of the report will cost CP$100. You can have the generated report sent to the email you used to register the account.

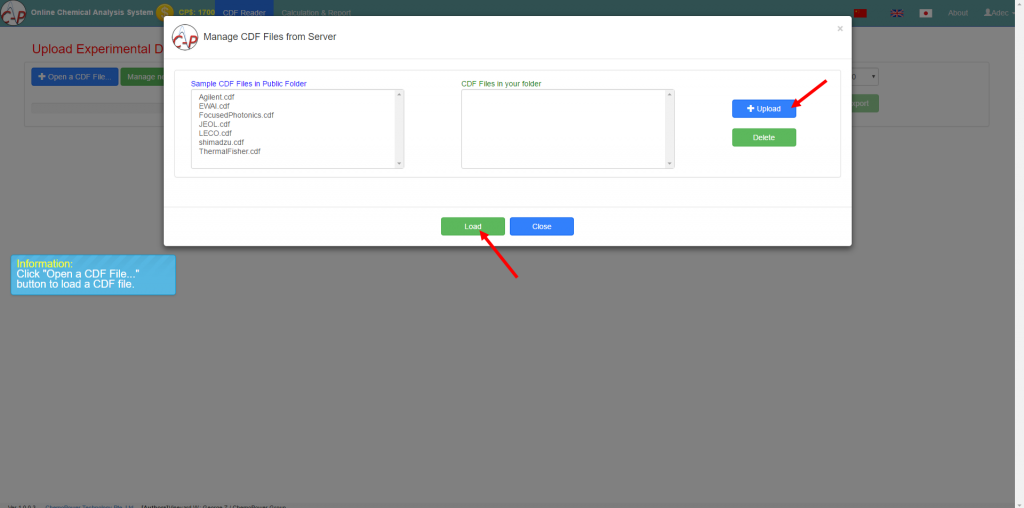
2) Upon entering the software, you will be prompted a window to let user to manage their Common Data Format (*.cdf) file on server. User can Upload a cdf file and Load it to start analysis. Otherwise, you may Select a trial data file from the existing public server and Load it into the software. Do note that the software only accepts .cdf file format. If you are prompted an error message when you try to upload the file, you are encouraged to upload a compressed cdf file (using Rar or Zip) to reduce the data size. Some instrument companies would have different extension name for cdf file, such as *.nc.
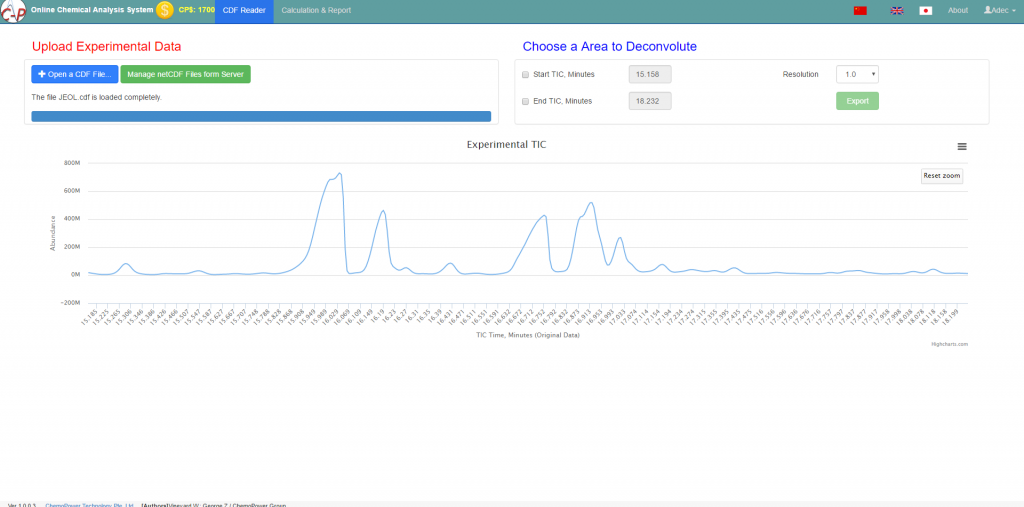
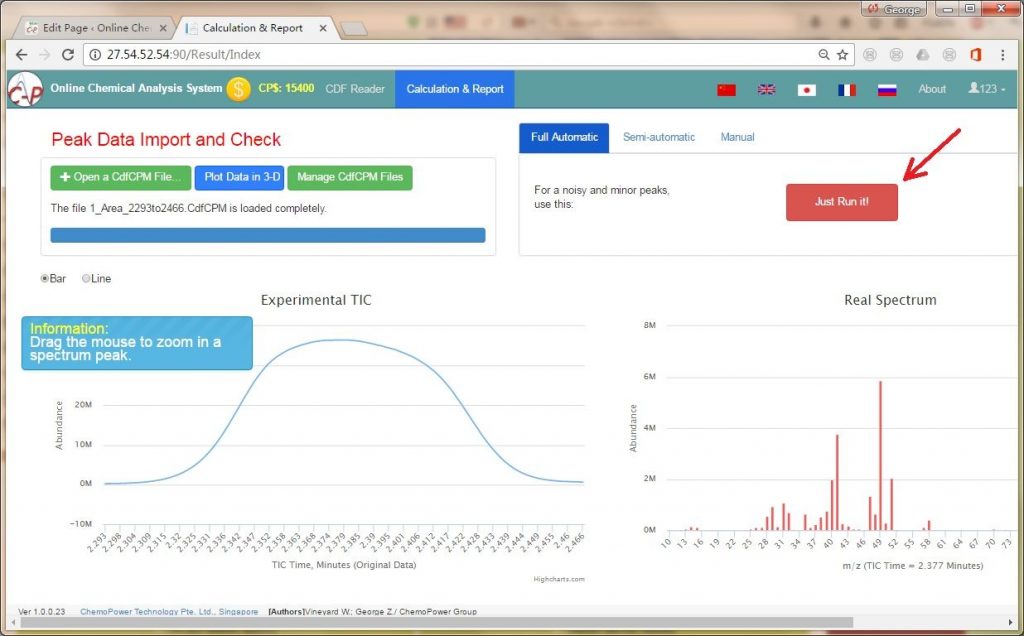
3) Once the data file is uploaded, you will see a graph plotted based on the data you have uploaded. Click and drag over the area on the graph you wish to deconvolute.

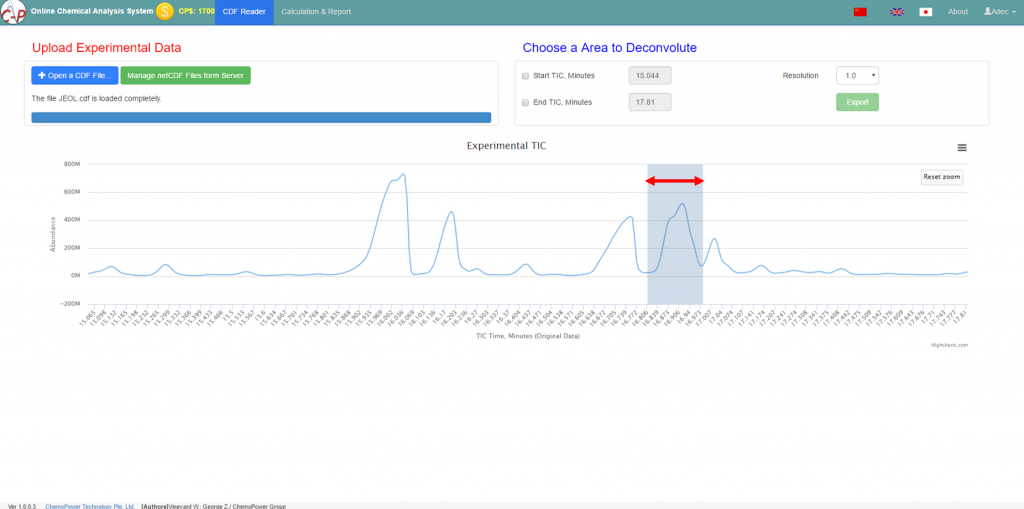
4) Next, you will see a zoomed in version of the area which you had selected earlier.
5) Similarly, click and drag over the area on the graph to further zoom in to the convoluted peak. Do note that OCAS only allows to export a TIC range less than 18 seconds or 0.3 minutes.
6) Once satisfied with the area which you wish to deconvolute, click on the “Export” button to start the deconvolution process. This “Export” button will remain disabled if the TIC range chosen is more than 18 Seconds. Kindly note that it may take a while for the results to appear and we would like to seek your patience if that happens.

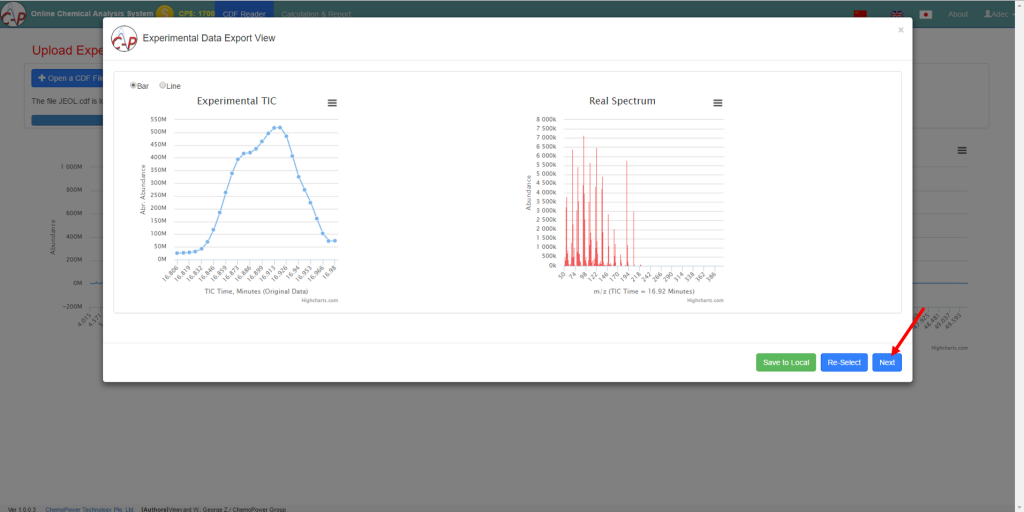
7) A window will pop up to allow you save the selected area to your local drive or re-select the area you wish to deconvolute. User may do nothing and Click “Next“ to continue.
8) Commonly,use need to deconvolute the minor and noise peak , simply click “ Just Run it!” to proceed (kindly note that it may take some time depending on users’ internet bandwidth, commonly would cost 3-10 seconds).
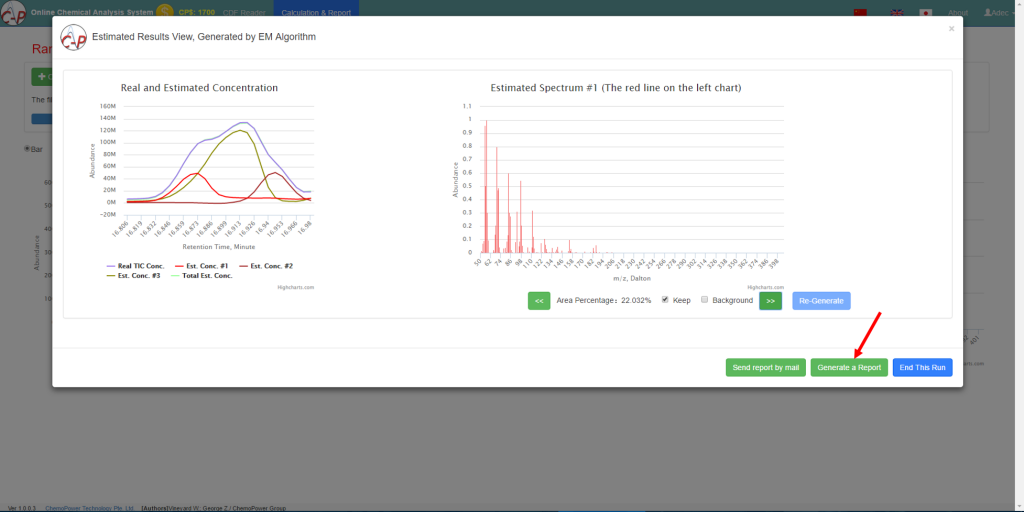
9) The software will return you with the results of the deconvolution, indicating the number of components contained within the peak and their estimated concentrations. You may send a report to your registered email by clicking on “Send report by mail“. Alternatively, you may generate a report online via “Generate a Report” (please enable pop-up windows, so that the report would be shown on a new window/tab). Upon generating the report, CP$100 will be deducted from your account. Click on “End This Run” to complete this session.
10) A sample of the generated report is as follows. You can click ‘Send Mail‘ to send the report to your registered email.

11) You can also check the detailed information of each Estimated Spectrum by clicking through the Tabs on the top of the page to display the Spectrum’s report, as follows:

12) An example of the Email report is as follows, and you can use the NIST Text File to match the generated Spectrums with the NIST data library. Please check your mail server and/or spam folder if you do not receive our email in your inbox.
 ———- End of OCAS Guide———